Credit_Risk_Analysis
Using Supervised Machine Learning to Predict Credit Risk

Background
Overview of Analysis
This project consists of three technical analysis deliverables and a written report.
-
Deliverable 1: Use Resampling Models to Predict Credit Risk
-
Deliverable 2: Use the SMOTEENN Algorithm to Predict Credit Risk
-
Deliverable 3: Use Ensemble Classifiers to Predict Credit Risk
-
Deliverable 4: A Written Report on the Credit Risk Analysis (README.md)
Purpose
Credit risk is an inherently unbalanced classification problem, as good loans easily outnumber risky loans. Therefore, we needed to employ different techniques to train and evaluate models with unbalanced classes.
Using the credit card credit dataset from LendingClub, a peer-to-peer lending services company, we’ll oversample the data using the RandomOverSampler and SMOTE algorithms, and undersample the data using the ClusterCentroids algorithm. Then, we’ll use a combinatorial approach of over- and undersampling using the SMOTEENN algorithm. Next, we’ll compare two new machine learning models that reduce bias, BalancedRandomForestClassifier and EasyEnsembleClassifier, to predict credit risk.
Resources
Data source:
- (1) credit_risk_ensemble_starter_code, (2) credit_risk_resampling_starter_code, (3) LoanStats_2019Q1
Software:
- Python 3.9.10, Jupyter Lab 4.6, Visual Studio Code 1.71.2
Methodology
D1: Use Resampling Models to Predict Credit Risk
Using the imbalanced-learn and scikit-learn libraries, we evaluated three machine learning models by using resampling to determine which was better at predicting credit risk. First, we used the oversampling RandomOverSampler and SMOTE algorithms, and then we used the undersampling ClusterCentroids algorithm. Using these algorithms, we resampled the dataset, viewed the count of the targeted classes, trained a logistic regression classifier, calculated the balanced accuracy score, generated a confusion matrix, and generated a classification report.
D2: Use the SMOTEENN algorithm to Predict Credit Risk
Using the imbalanced-learn and scikit-learn libraries, we used a combinatorial approach of over- and undersampling with the SMOTEENN algorithm to determine if the results from the combinatorial approach were better at predicting credit risk than the resampling algorithms from Deliverable 1. Using the SMOTEENN algorithm, we resampled the dataset, viewed the count of the targeted classes, trained a logistic regression classifier, calculated the balanced accuracy score, generated a confusion matrix, and generated a classification report.
D3: Use Ensemble Classifiers to Predict Credit Risk
Using the imblearn.ensemble library, we train and compare two different ensemble classifiers, BalancedRandomForestClassifier and EasyEnsembleClassifier, to predict credit risk and evaluate each model. Using both algorithms, we resampled the dataset, viewed the count of the targeted classes, trained the ensemble classifier, calculated the balanced accuracy score, generated a confusion matrix, and generated a classification report.
Results:
D1. For all three algorithms, the following have been completed:
RandomOverSampler
Findings:
- Balance accuracy score: 0.832
- Precision: high_risk 0.03, low_risk 1.00
- Recall: high_risk *0.82, low_risk 0.84
- F1: high_risk 0.06, low_risk: 0.91
An accuracy score for the model is calculated:

Figure (1.1) RandomOverSampler balanced accuracy report
A confusion matrix has been generated:
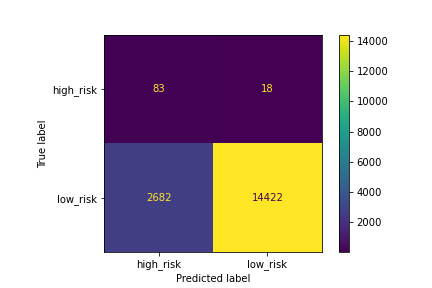
Figure (1.2) RandomOverSampler matrix
#### An imbalanced classification report has been generated:

Figure (1.3) RandomOverSampler imbalanced classification report
SMOTE
Findings:
- Balance accuracy score: 0.884
- Precision: high_risk 0.03, low_risk 1.00
- Recall: high_risk *0.82, low_risk 0.87
- F1: high_risk 0.07, low_risk: 0.93
An accuracy score for the model is calculated:

Figure (1.4) SMOTE balanced accuracy report
A confusion matrix has been generated:
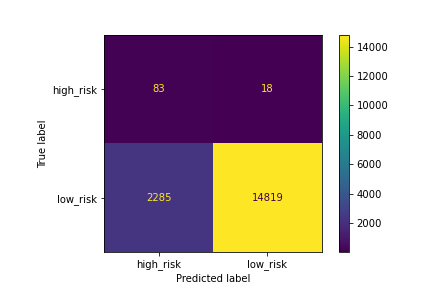
Figure (1.5) SMOTE confusion matrix
An imbalanced classification report has been generated:

Figure (1.6) SMOTE imbalanced classification report
ClusterCentroids
Findings:
- Balance accuracy score: 0.884
- Precision: high_risk 0.03, low_risk 1.00
- Recall: high_risk *0.82, low_risk 0.87
- F1: high_risk 0.07, low_risk: 0.93
An accuracy score for the model is calculated:

Figure (1.7) ClusterCentroids balanced accuracy report
A confusion matrix has been generated:
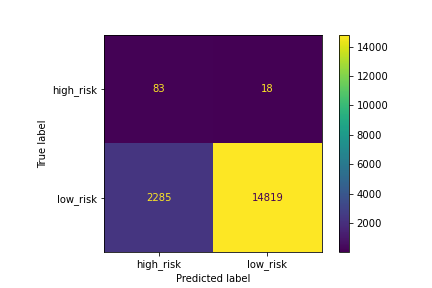
Figure (1.8) ClusterCentroids_confusion_matrix
An imbalanced classification report has been generated:

Figure (1.9) ClusterCentroids imbalanced classification report
D2. The combinatorial SMOTEENN algorithm does the following:
SMOTEENN
Findings:
- Balance accuracy score: 0.884
- Precision: high_risk 0.03, low_risk 1.00
- Recall: high_risk *0.82, low_risk 0.87
- F1: high_risk 0.07, low_risk: 0.93
An accuracy score for the model is calculated:

Figure (1.10) SMOTEEN balanced accuracy report
A confusion matrix has been generated:
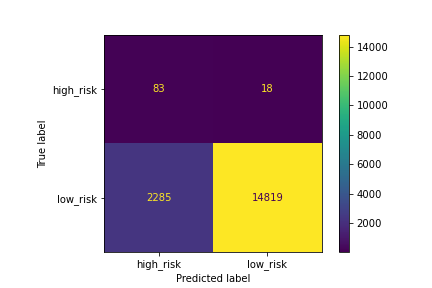
Figure (1.11) SMOTEENN matrix
An imbalanced classification report has been generated:

Figure (1.12) SMOTEENN imbalanced classification report
D3. The algorithm does the following:
BalancedRandomForestClassifier
Findings:
- Balance accuracy score: 0.759
- Precision: high_risk 0.03, low_risk 1.00
- Recall: high_risk *0.63, low_risk 0.88
- F1: high_risk 0.06, low_risk: 0.94
#### An accuracy score for the model is calculated:

Figure (1.13) BalancedRandomForestClassifier balanced accuracy report
#### A confusion matrix has been generated
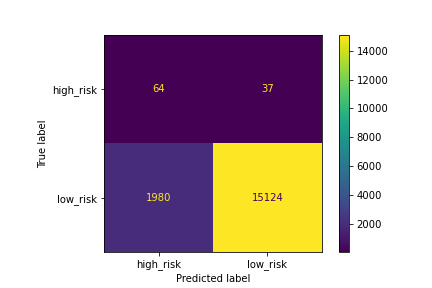
Figure (n) BalancedRandomForestClassifier matrix
An imbalanced classification report has been generated:

Figure (1.14) BalancedRandomForestClassifier imbalanced classification report
The features are sorted in descending order by feature importance:
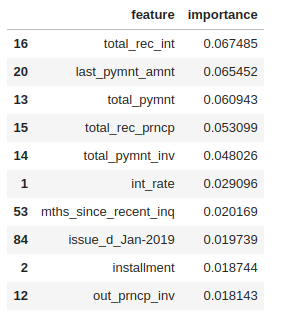
Figure (1.15) features_sorted_in_descending_order
EasyEnsembleClassifier
Findings:
- Balance accuracy score: 0.932
- Precision: high_risk 0.03, low_risk 1.00
- Recall: high_risk 0.92, low_risk 0.94
- F1: high_risk 0.16, low_risk: 0.97
An accuracy score of the model is calculated:

Figure (1.16) EasyEnsembleClassifier balanced accuracy_ report
#### A confusion matrix has been generated:
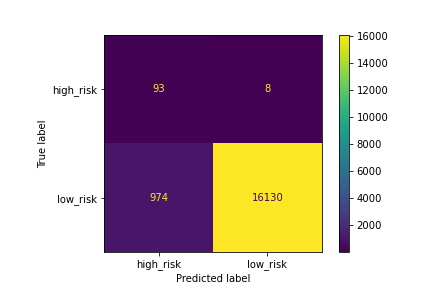
Figure (1.17) EasyEnsembleClassifier_matrix
An imbalanced classification report has been generated:

Figure (1.18) EasyEnsembleClassifier imbalanced classification report
Summary
The recall (sensitivity) for prediction of the high risk and low_risk are in line with each other for most of the models. However, the precision for predicting high risk is much lower than it is for predicting low risk. The lower precision for high risk is reflected in the dropped F1 score.
In this scenario, the sensitivity is very high, while the precision is very low. Clearly, this is not a useful algorithm, so let’s take a look at the F1 value. A pronounced imbalance between sensitivity and precision will yield a low F1 score.
The F1 values for our models:
-
RandomOverSampler - 0.06
-
SMOTE - 0.07
-
ClusterCentroids - 0.07
-
SMOTEENN - 0.07
-
BalancedRandomForestClassifier - 0.06
-
EasyEnsembleClassifier - 0.16
The accuracy scores for our models:
-
RandomOverSampler - 83.2
-
SMOTE - 88.4
-
ClusterCentroids - 88.4
-
SMOTEENN - 88.4
-
BalancedRandomForestClassifier - 75.9
-
EasyEnsembleClassifier - 93.2
To summarize our results, we’ll focus on our targeted class (high_risk), out of the 6 models:
-
RandomOverSampler performed the worst with an F1 value of 0.06 (higher imbalance) and accuracy score of 83.2.
-
EasyEnsembleClassifier performed the best with an F1 value of 0.16 (less imbalance) and accuracy score of 93.2.
In general the models were not very good at predicting high risk since the F1 values for most models were between 0.06-0.07. However, from our 6 models we would recommend the EasyEnsembleClassifier since the model did a better job classifying the data, improved the F1 value from 0.06 to 0.16, and had a better accuracy score with 93.2%.
For future evaluations we may want to explore the use of Precision-Recall Curve to compare the model performances in imbalanced data sets.